Create: Update:
JUNE 7, 2025
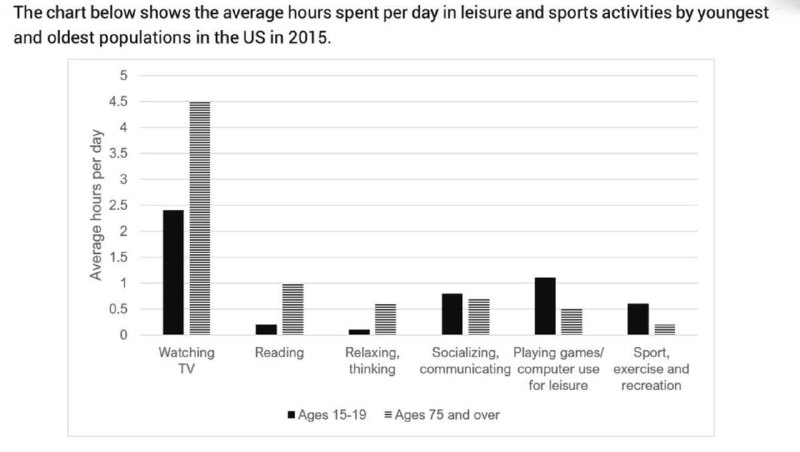
📊 TASK 1: The chart below shows the average hours spent per day in leisure and sports activities by youngest and oldest populations in the US in 2015.
@otaboyevblog

>>Click here to continue<<
G'anisher Otaboyev | Blog